Popular printable mood trackers include Monthly Mandala Circles, Flower Petal Charts, and Weather-Inspired Calendars, offering creative ways to monitor emotional well-being. These free tools range from minimalist daily grids to artistic geometric patterns, helping users identify emotional patterns and triggers. Each design serves different preferences, from simple color-coding to detailed habit integration. Mental health professionals recommend consistent mood tracking for enhanced self-awareness. Exploring various tracker styles can reveal personalized paths to emotional wellness.
Monthly Mandala Mood Circle
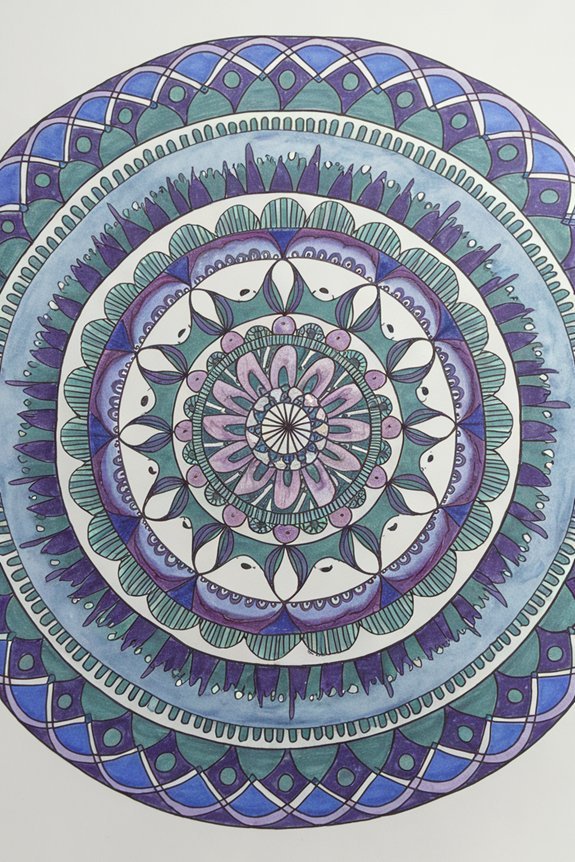
The Monthly Mandala Mood Circle offers a creative and meditative approach to tracking emotional well-being through a circular calendar design. Each day of the month is represented by a segment in the circle, which users color or pattern according to their emotional state. The process of coloring these segments becomes a mindful daily ritual that encourages self-reflection and emotional awareness.
The mandala color balance plays a vital role in visualizing emotional patterns throughout the month. Users can assign specific colors to different moods – for example, yellow for joy, blue for calm, or red for anger. Additionally, mandala doodle variations allow for personalized expression within each segment, offering an artistic outlet for processing emotions. Beyond tracking, this visual tool helps identify triggers, patterns, and emotional cycles, enabling users to make informed decisions about their mental health care. The circular format also symbolizes the continuous nature of emotional wellness and personal growth.
Simple Daily Emotion Grid
Looking for a straightforward approach to emotional tracking? The Simple Daily Emotion Grid offers an uncomplicated method for daily mood journaling that helps identify simple emotion patterns over time. This minimalist tracking system uses a basic grid layout where each day of the month intersects with common emotional states.
Track your emotional journey simply and effectively with the Daily Emotion Grid – where minimalism meets meaningful self-reflection.
Users can quickly mark their predominant emotions each day using this grid system, which provides valuable insights into emotional well-being. The straightforward design makes it easy to maintain consistency in tracking while eliminating the complexity often found in other mood monitoring methods.
Key benefits of the Simple Daily Emotion Grid include:
- Quick visual representation of emotional trends
- Minimal time investment required for daily tracking
- Easy pattern identification for sharing with mental health professionals
The grid's simplicity encourages regular use, making it an effective tool for those beginning their emotional awareness journey or seeking a no-frills approach to understanding their psychological well-being.
Weather-Inspired Mood Chart
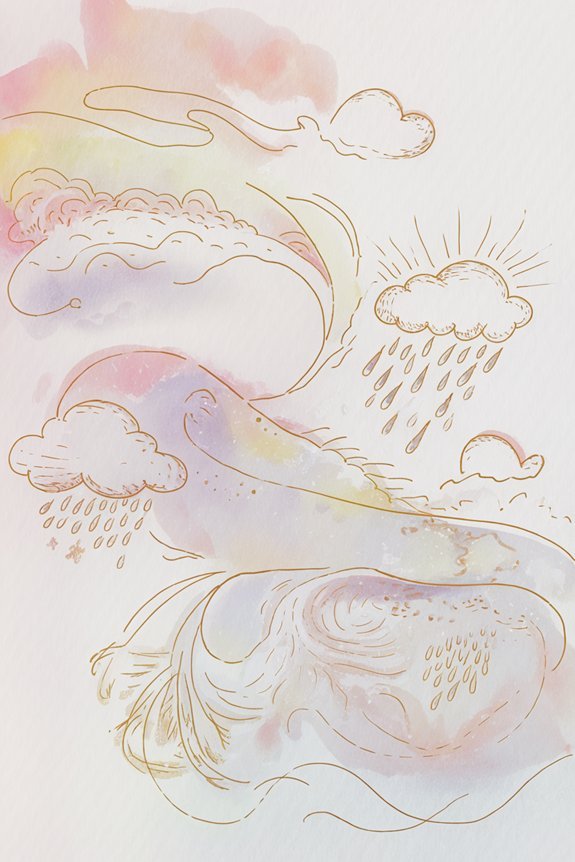
Drawing inspiration from nature's ever-changing patterns, a weather-inspired mood chart transforms emotional tracking into an intuitive visual experience. This method uses familiar weather symbols to represent different emotional states, making it accessible and relatable for users of all ages.
The chart typically includes symbols such as sunny skies for positive moods, storm clouds for difficult emotions, and gentle rain for contemplative states. Users can track their “rainy day blues” or note when they experience a “sunshine mood boost,” creating a meaningful connection between their internal landscape and natural phenomena.
Each day, individuals mark their emotional weather on a monthly calendar grid using these symbols. This visual approach helps identify patterns and triggers while normalizing the fluctuation of feelings. The weather metaphor also removes stigma from challenging emotions by presenting them as natural, temporary conditions that, like all weather patterns, eventually change.
Year-at-a-Glance Color Wheel
The Year-at-a-Glance Color Wheel provides a thorough visual representation of emotional patterns through a simple yet effective color-coding system. Users assign specific colors to different emotional states, such as yellow for joy, blue for calm, or red for anger, and fill in each day's corresponding space on the circular calendar. This annual view enables individuals to identify emotional trends, seasonal patterns, and potential triggers while maintaining a straightforward daily practice of self-reflection.
Daily Color Coding Guide
A color-coded mood tracker serves as an elegantly simple yet powerful visualization tool for monitoring emotional wellness throughout the year. When developing a personalized color palette selection, users can align specific hues with their emotional experiences, creating an intuitive system for daily mood evaluation criteria.
The foundational elements of an effective daily color coding system include:
- Clear mood-to-color associations (e.g., yellow for joy, blue for calm, red for anger)
- Consistent application of designated colors across all tracking periods
- A defined spectrum that accommodates subtle emotional variations
This systematic approach enables individuals to identify patterns in their emotional well-being through visual data. By maintaining a daily practice of color-coding moods, users can better understand their mental health trends and share meaningful insights with mental health professionals when needed.
Tracking Your Annual Moods
Creating a year-at-a-glance color wheel transforms scattered daily mood data into a detailed annual visualization, allowing users to observe seasonal patterns and long-term emotional trends. This yearly mindfulness tool divides the year into 12 segments, with each month's moods represented through color-coded sections.
| Time Period | Benefits |
|---|---|
| Spring | Identify mood shifts during seasonal changes |
| Summer | Track impact of increased daylight on wellbeing |
| Fall | Monitor shifts and holiday-related emotions |
| Winter | Assess effects of reduced sunlight exposure |
| Quarter Review | Compare mood patterns across 3-month spans |
| Annual Summary | Enable long term self reflection and growth |
The color wheel format provides an intuitive way to spot recurring patterns, helping individuals make informed decisions about their mental wellness strategies and lifestyle adjustments throughout the year.
Flower Petal Progress Tracker
The Flower Petal Progress Tracker offers a creative approach to monitoring emotional well-being through daily petal coloring that corresponds to different moods and feelings. Users fill in one petal each day with colors that represent specific emotions, such as yellow for joy, blue for calm, or red for anger, creating a visual record of their emotional journey. The completed flower reveals monthly emotional patterns, allowing individuals to identify triggers, celebrate positive changes, and make informed decisions about their mental health care.
Daily Petal Fill-In
When seeking a visually engaging way to track daily moods, flower petal progress trackers offer an artistic and intuitive solution. Daily petal fill-in systems allow users to color or shade individual petals based on their emotional state, creating a beautiful record of mental wellness over time.
Single petal designs can be customized through various petal fill-in examples:
- Color-coding each petal to represent different mood intensities, from vibrant hues for positive emotions to softer shades for challenging days
- Using patterns or textures within petals to add depth to emotional documentation
- Implementing gradients that reflect the nuanced nature of daily emotional experiences
This systematic approach transforms abstract feelings into tangible visual data, helping individuals recognize patterns and maintain awareness of their emotional well-being while creating an aesthetically pleasing journal entry.
Color Coding Emotions
Building an effective flower petal mood tracker starts with establishing a meaningful color coding system. Users can select colors that intuitively represent their emotional states, creating a personalized emotional color palette that resonates with their experiences. Traditional chromotherapy techniques suggest using warm colors like red and orange for high-energy emotions, while cool tones like blue and green represent calmer states.
Each petal on the tracker becomes a canvas for emotional expression, with colors indicating daily mood fluctuations. Common associations include yellow for joy, blue for sadness, red for anger, green for contentment, and purple for anxiety. This visual system allows individuals to quickly identify patterns in their emotional well-being over time. The color-coded petals create an accessible snapshot of mental health progress, making it easier to share insights with mental health professionals when needed.
Track Monthly Growth Pattern
Monthly flower petal tracking transforms abstract emotional data into a visually engaging growth pattern, where each petal represents a day's emotional state within a 30-31 day cycle. By monitoring these patterns, individuals can identify correlations between their moods and seasonal changes, gaining valuable insights into their emotional well-being.
The flower petal progress tracker offers distinct advantages:
- Reveals recurring emotional patterns that may align with annual fluctuations in weather, daylight hours, or personal routines
- Provides an all-encompassing month-at-a-glance view that helps identify triggers and positive influences
- Creates an aesthetically pleasing visual record that encourages consistent mood tracking and self-reflection
This artistic approach to mood tracking not only simplifies data collection but also serves as a meaningful tool for understanding long-term emotional trends and personal growth throughout the year.
Minimalist Monthly Squares
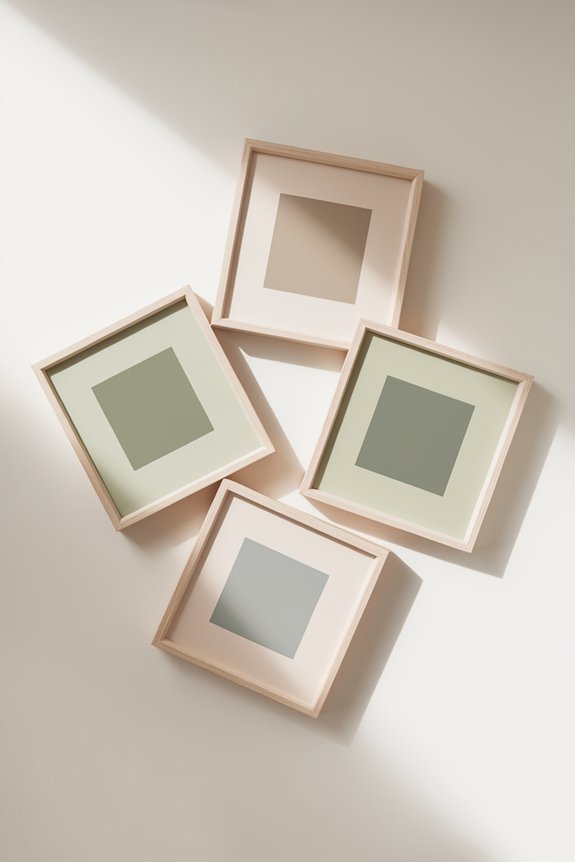
A minimalist monthly squares layout offers a streamlined approach to mood tracking that combines simplicity with effectiveness. These concise tracker layouts feature a clean grid system where each day is represented by a single square, allowing users to color-code their moods efficiently.
| Mood State | Color Code | Usage Tips |
|---|---|---|
| Positive | Green | Joy, enthusiasm |
| Neutral | Yellow | Contentment, calm |
| Negative | Blue | Sadness, anxiety |
| Energetic | Orange | High activity |
| Tired | Purple | Low energy |
| Stressed | Red | Tension, worry |
| Mixed | Gray | Complex feelings |
| Peaceful | Light Blue | Tranquility |
| Creative | Pink | Inspiration |
| Focused | Brown | Concentration |
| Irritable | Dark Red | Frustration |
| Grateful | Gold | Appreciation |
The customizable design elements allow individuals to adapt their tracking system using preferred colors, symbols, or patterns while maintaining the essential minimalist structure. This straightforward approach helps identify emotional patterns without overwhelming the user with complex logging requirements.
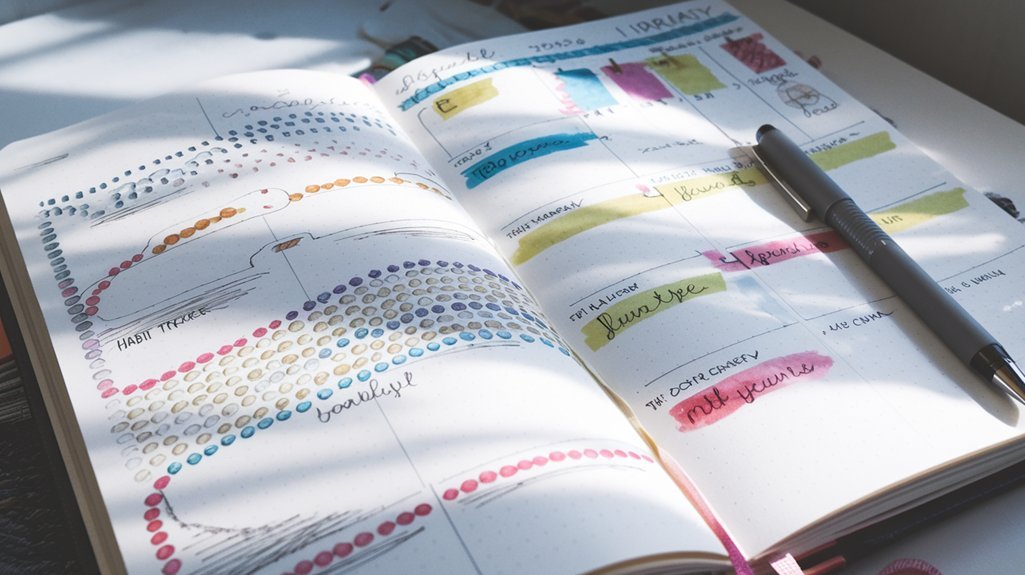
Habit and Mood Combined Calendar
Integrating habits with mood tracking creates a detailed wellness calendar that reveals potential connections between daily routines and emotional states. This combined approach helps individuals understand how specific behaviors influence their emotional well-being, facilitating both habit formation and mood improvement over time.
By linking habits and moods, we gain powerful insights into how our daily choices shape our emotional landscape and overall well-being.
The unified calendar system offers three key benefits:
- Visual correlation between daily activities and emotional patterns, making it easier to identify which habits positively or negatively impact mood
- Streamlined tracking process that reduces the mental load of maintaining separate logs for habits and emotions
- Enhanced accountability through a thorough overview of wellness goals and emotional wellness in one centralized location
When designed thoughtfully, this combined tracker serves as a powerful tool for personal development, allowing users to adjust their routines based on mood data while maintaining consistency in their habit-building journey. The synergistic approach provides valuable insights for making informed lifestyle adjustments that support mental wellness.
Geometric Pattern Tracker
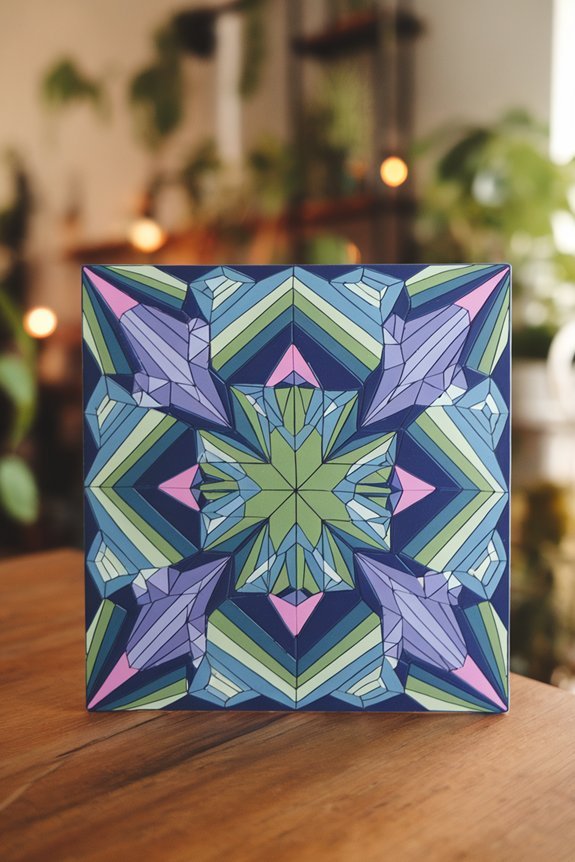
Creative geometric patterns provide a visually engaging approach to mood tracking, where shapes, colors, and designs combine to form an intuitive representation of emotional states. The geometric graph visualization offers users a structured yet artistic way to document their daily emotional experiences through interconnected shapes and patterns.
Each geometric shape can represent different mood intensities, while color-coding adds another layer of emotional expression. Users can fill in triangles, hexagons, or other repeating patterns daily, creating an artistic geometric pattern that reflects their emotional journey. This method appeals particularly to individuals who process information visually or enjoy abstract representations of data.
The completed tracker transforms into both a practical monitoring tool and a piece of geometric art, making emotional awareness more accessible and enjoyable. As patterns emerge over time, users can easily identify emotional trends and triggers while maintaining an aesthetically pleasing record of their mental wellness journey.
Seasonal Tree Mood Monitor
The Seasonal Tree Mood Monitor transforms nature's cyclical patterns into an intuitive tracking system, where users document their emotional states through a visual metaphor of a growing tree. Drawing fall foliage inspiration from nature's palette, this tracker allows individuals to color branches, leaves, and roots to represent different emotional states throughout the year.
The design incorporates seasonal tree silhouettes that evolve as users progress through their emotional journey. Each element serves as a meaningful representation of mental states:
- Branches symbolize strength and growth, with upward reaching limbs reflecting resilience
- Leaves display daily moods through color coding – greens for positive days, browns for challenging ones, and golds for neutral states
- Roots ground the design, deepening as users develop greater emotional awareness
This organic approach to mood tracking resonates with those seeking a more artistic and nature-connected method of emotional documentation while maintaining therapeutic value.
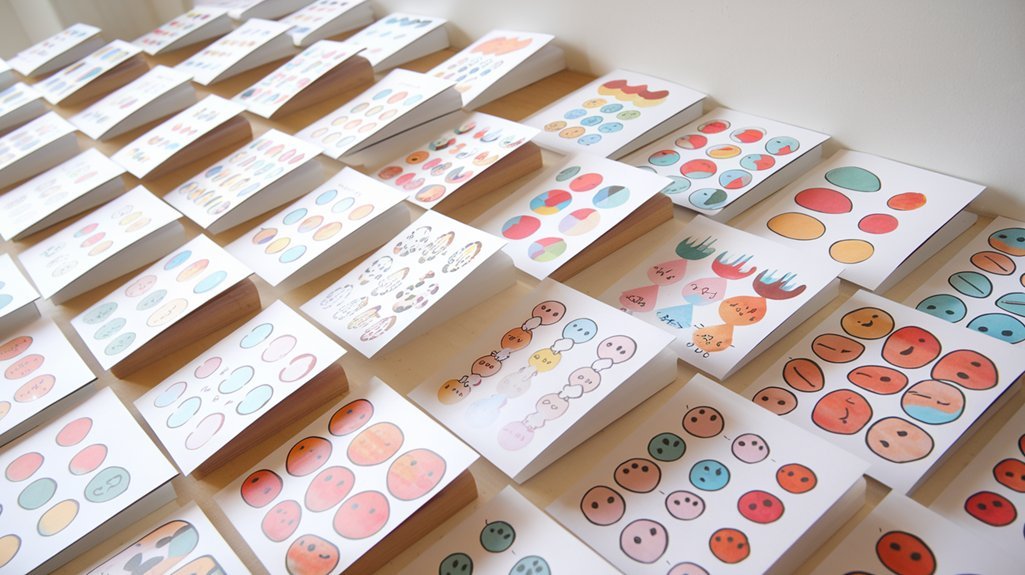
Weekly Emotion Bubbles
Numerous mental health practitioners recommend Weekly Emotion Bubbles as an engaging visual method for tracking moods throughout each seven-day period. This tracker features seven circular spaces, one for each day, where individuals can color-code their emotional states using predetermined hues that represent different feelings.
The bubbles can be filled with varying intensities of color to indicate daily happiness levels, anxiety, or stress. Users typically choose colors like yellow for joy, blue for sadness, or red for anger, creating a clear visual representation of their weekly mood fluctuations. Some versions include space for brief notes beside each bubble to document triggers or significant events.
This straightforward design helps people identify patterns in their emotional well-being and facilitates meaningful discussions with mental health professionals. The simplicity of the bubble format makes it accessible to users of all ages while providing valuable insights into emotional trends over time.
Conclusion
Research shows that people who track their moods for just 30 days experience a 27% improvement in emotional self-awareness. These printable mood trackers offer accessible, creative ways to monitor mental wellness through visual documentation. Whether choosing the meditative mandala design or the systematic emotion grid, users can transform abstract feelings into tangible patterns, making emotional health management both insightful and achievable. The journey to better mental wellness starts with a single mark on the page.